Download a Confidence Interval Calculator designed by Wael Abed, Financial Modeling Expert
Primary Target Query: « Calculate confidence interval in Excel »
Secondary Keywords:
- « Excel confidence interval formula »
- « confidence interval example Excel »
- « free Excel template confidence interval »
- « Excel statistics confidence interval »
- « calculate margin of error in Excel »
Introduction
The confidence interval is a crucial statistical tool for assessing the precision of an estimate. Whether you’re a student, data analyst, or professional, this guide will show you how to calculate a confidence interval in Excel in just a few simple steps. Download our free Excel template to save time and streamline your calculations!
H2: What is a Confidence Interval?
A confidence interval is a range of values that contains, with a certain probability (e.g., 95%), the true value of a statistical parameter. It is widely used in:
- Market research to estimate customer preferences.
- Scientific studies to validate experimental results.
- Surveys to measure the margin of error.
Why is it important?
- It evaluates the reliability of an estimate. It helps make data-driven decisions.
H2: Key Excel Formulas for Confidence Intervals
To calculate a confidence interval in Excel, you’ll need the following formulas:
- =AVERAGE(range): Calculates the mean of the data.
- =STDEV(range): Measures the variability of the data.
- =T.INV(α, degrees_of_freedom): Finds the critical value (t) for a given confidence level.
- =SQRT(COUNT(range)): Calculates the square root of the sample size.
Complete Formula:=AVERAGE(range) ± T.INV(α, COUNT(range)-1) * (STDEV(range) / SQRT(COUNT(range)))
External Link Placement:
For more advanced Excel functions, visit the Microsoft Excel Support Page.
H2: Step-by-Step Example: Calculating a Confidence Interval in Excel
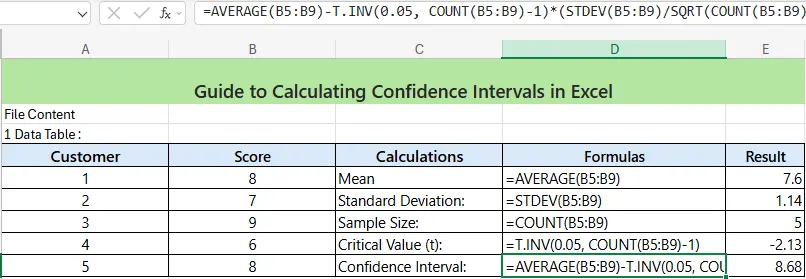
Let’s take a practical example with customer satisfaction scores (out of 10):
| Customer | Score |
|---|---|
| 1 | 8 |
| 2 | 7 |
| 3 | 9 |
| 4 | 6 |
| 5 | 8 |
Step 1: Calculate the Mean=AVERAGE(B2:B6) → 7.6 Step 2: Calculate the Standard Deviation=STDEV(B2:B6) → 1.14
Step 3: Find the Critical Value (t)=T.INV(0.05, COUNT(B2:B6)-1) → 2.776
Step 4: Calculate the Confidence Interval7.6 ± 1.42 → Interval: [6.18 ; 9.02]
Interpretation: We are 95% confident that the true average satisfaction score lies between 6.18 and 9.02.
Image 1 Placement:
Add a screenshot of the Excel example (customer satisfaction scores table) here.
Alt Text: « Example of calculating a confidence interval in Excel. »
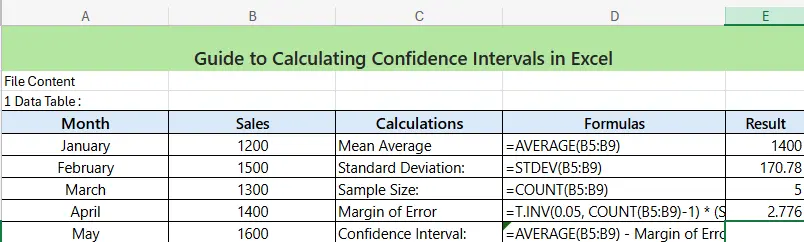
H2: Automating the Process in Excel
To save time, combine all steps into a single formula:=AVERAGE(range) ± T.INV(α, COUNT(range)-1) * (STDEV(range) / SQRT(COUNT(range)))
Image 2 Placement:
Include a graph showing a confidence interval (e.g., a bar chart with error bars) here.
H2: Download Our Free Excel Template
To make your calculations even easier, download our free Excel template, which includes:
- Pre-built formulas for confidence intervals.
- Example datasets to get you started.
- Step-by-step instructions embedded in the file.
H2: FAQ on Confidence Intervals in Excel
Q1: What’s the difference between a 90% and 95% confidence interval?
- A 90% confidence interval is narrower but less precise than a 95% confidence interval.
Q2: How do I interpret a confidence interval that includes zero?
- If the interval includes zero, the observed effect may be due to chance.
Q3: Is Excel suitable for advanced statistical calculations?
- Excel is great for basic analyses. For advanced statistics, consider using software like R or Python
H2: Conclusion
Calculating a confidence interval in Excel is simpler than you might think. With the right formulas and a clear understanding of statistical concepts, you can analyze your data with precision. Use this guide and our free Excel template to master this technique and apply it to your own projects.
SEO Optimization and Additional Elements
1. External Link Placement
- Where to Add: In the Key Excel Formulas section.
- Example: »For more advanced Excel functions, visit the Microsoft Excel Support Page. »
2. Internal Link Placement
- Where to Add: In the Conclusion.
- Example: Explore our guide on Excel Statistics Tools for more tips and tricks.
3. Free Excel File Placement
- Where to Add: In the Download Our Free Excel Template section.