Download the Sales Forecast Template designed by Wael Abed, Financial Modeling Expert.
Introduction: Why a Sales Forecast Template in Excel Matters
In the world of sales and business management, being wrong about your revenue projections isn’t just embarrassing—it’s a direct threat to your company’s stability, growth, and decision-making. Many businesses still rely on gut feeling or simplistic models, leading to cash flow crises, missed opportunities, and strategic mistakes. Therefore, mastering how to create and use a robust Sales Forecast Template in Excel is one of your most powerful strategic advantages.
A well-structured forecast is not a crystal ball. Instead, it’s a data-driven model that transforms sales activities, market knowledge, and historical data into a clear, actionable financial roadmap. In this guide, you’ll discover not only the theory behind effective forecasting but also a free, automated Excel template ready for download and immediate implementation.
By the end, you’ll understand how to design forecasts that inspire confidence across your team, management, and investors. Download your free automated Sales Forecast Template in Excel now to follow along and start applying these methods today!
Chapter 1: The Foundational Principles of Sales Forecasting
1.1. What Is a Sales Forecast and Why Is It Essential?
A sales forecast is a projection of future customer demand for your products or services over a defined period. It’s typically measured in revenue or units. Essentially, your forecast serves as the operational heartbeat of your business—it guides budgeting, hiring, production, and marketing strategies.
Accurate forecasting benefits every department. Finance teams rely on it for budgeting and cash flow management. Operations use it for inventory and production planning. Human Resources depends on it for workforce strategy, while Marketing leverages it to assess campaign ROI. Consequently, leadership uses it to set company-wide goals and drive strategic decisions.
According to a report by Clari on the State of Revenue Intelligence, companies with precise sales forecasting are 10% more likely to grow year-over-year. This proves that an Excel sales forecast template is not just a spreadsheet—it’s a genuine growth engine.
1.2. Top-Down vs. Bottom-Up Forecasting
Before you even open Excel, you must decide on your forecasting approach. There are two primary methods: Top-Down and Bottom-Up.
Top-Down Forecasting
This method starts from the broader market and narrows down to your company’s expected share.
- Process: Begin with your Total Addressable Market (TAM), estimate your market share, and calculate potential sales.
- Best For: Startups or businesses entering a new market.
- Pros: Quick and strategic.
- Cons: Often disconnected from on-the-ground reality.
Bottom-Up Forecasting
In contrast, the bottom-up method builds from individual data points, such as leads, conversion rates, and deal values.
- Process: Aggregate data from your sales team, historical records, and marketing funnel.
- Best For: Established companies with reliable data.
- Pros: Highly accurate and grounded in operations.
- Cons: More time-consuming without an automated Excel model.
To explore market sizing and forecasting methods, you can consult the U.S. Small Business Administration’s excellent market analysis resources.
Chapter 2: Building Your Sales Forecast Template in Excel
2.1. The Core Structure of a Forecast Template
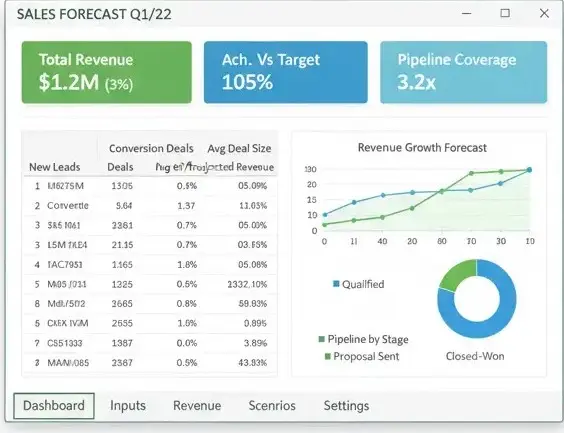
A professional Excel forecast template is not just a data list—it’s an interconnected system. To be efficient, your workbook should include:
- Executive Dashboard: A summary of KPIs and performance charts.
- Inputs & Assumptions: Centralized parameters such as growth or conversion rates.
- Revenue Forecast Sheet: Your main monthly or quarterly projection.
- Sales Pipeline Model: A view of deals by stage.
- Scenario Planner: For best, base, and worst-case simulations.
2.2. Building the Revenue Forecast Engine
Start with a bottom-up approach.
Step 1: Define Your Sales Funnel
Create a table like this in your “Inputs” sheet:
| Funnel Stage | Description | Conversion Rate |
|---|---|---|
| Lead | Marketing Qualified Lead | – |
| Qualified | Sales Qualified Lead | 25% |
| Meeting Held | Demo or discovery call | 60% |
| Proposal Sent | Formal quote issued | 50% |
| Closed-Won | Deal signed | 40% |
Step 2: Create the Excel Logic
In your “Revenue Forecast” sheet, set up formulas such as:
| Month | New Leads | Forecasted Revenue |
|---|---|---|
| January | =Assumptions!$B$4 | =NewLeads*(Conv1Conv2Conv3)*AverageDealSize |
This design ensures that if you adjust assumptions like lead volume or conversion rates, the entire forecast recalculates automatically—a key advantage of a data-driven Excel model.
Chapter 3: Advanced Excel Forecasting Techniques for Accurate Sales Predictions
3.1. Incorporating Seasonality and Market Trends
Flat forecasts are rarely accurate. Most businesses face seasonal variations, so integrating seasonality indices is essential.
To calculate these indices:
- Gather at least two years of monthly sales.
- Find each month’s average.
- Compute the overall monthly average.
- Divide each month’s average by the overall mean.
For example, if December’s index is 1.15, it means your sales are typically 15% above average. Multiply your base forecast by these indices to make it more realistic.
3.2. Using Scenario Analysis for Uncertainty
The future is uncertain, so a single forecast line is risky. Instead, design multi-scenario forecasting inside Excel.
The Three Key Scenarios
- Base Case: Your expected result.
- Upside Case: If conditions improve.
- Downside Case: If challenges arise.
Using Excel’s Data Table feature under “What-If Analysis,” you can easily visualize how changing key assumptions (like conversion rates or deal sizes) affects total revenue.
Chapter 4: Key Metrics and KPIs for Your Sales Forecast Template Excel
4.1. Core Forecasting KPIs
To monitor forecast health, include these metrics on your dashboard:
| KPI | Formula | Why It Matters |
|---|---|---|
| Variance to Target | (Actual / Target) – 1 | Measures goal achievement. |
| Forecast Accuracy | (Actual / Forecast) – 1 | Evaluates model reliability. |
| Sales Growth Rate | (Current / Prior Year) – 1 | Tracks momentum. |
| Pipeline Coverage | Pipeline / Quota | Ensures sufficient deal flow. |
Monitoring these KPIs helps identify weaknesses and adjust strategy quickly.
4.2. Leading vs. Lagging Indicators
Accurate forecasting depends on balancing leading and lagging indicators.
- Lagging indicators reflect past performance, such as last quarter’s sales.
- Leading indicators, like qualified leads or web traffic, predict future performance.
By linking these variables in Excel, you can forecast changes before they impact actual results. For instance, a 10% drop in new leads today could signal a revenue dip in two months.
Chapter 5: Download Your Free Sales Forecast Template Excel
What’s Inside the Template
We’ve created a ready-to-use Excel file that includes everything discussed:
Dynamic dashboard with automated charts.
Bottom-up revenue model based on funnel logic.
Integrated scenario planner.
Centralized input sheet for easy updates.
Simple pipeline tracker.
This isn’t just another spreadsheet—it’s an automated forecasting engine designed to save time and enhance accuracy.
For more insights and practical examples, explore more Excel Financial Analysis tutorials to improve your business reporting and data interpretation skills.
Click here to download your free Sales Forecast Template Excel.
Chapter 6: Common Excel Forecasting Mistakes to Avoid
6.1. Frequent Forecasting Pitfalls
Even the best template can fail due to user errors. Here are three common mistakes:
Mistake #1: “Set-and-Forget” Forecasts
Many teams build a forecast once and never update it. To fix this, review it weekly or bi-weekly and refresh assumptions with the latest data.
Mistake #2: Overly Complex Models
A confusing workbook discourages collaboration. Keep your file clear, documented, and user-friendly.
Mistake #3: Ignoring the “Why” Behind Numbers
Always explain results with their drivers. For instance:
“We’re forecasting $150K due to 50 new leads from our Q4 campaign converting at 12%.”
For more insights, check our guide on Advanced Excel Formulas for Finance.
To dive deeper into professional forecasting methods, learn how to create a forecast in Excel via Microsoft Support:
Create a forecast in Excel for Windows
FAQ – Sales Forecasting in Excel
How often should I update my sales forecast?
Weekly or bi-weekly updates are best. This allows time to incorporate closed deals and evolving conversion rates.
Can I use this for a startup?
Yes! Even without historical data, you can use estimated conversion rates and adjust them over time.
What’s the difference between a sales goal and a forecast?
A goal is a target; a forecast is a realistic projection. The forecast should guide your goal-setting process.
How do I forecast a new product with no data?
Start with top-down analysis and leading indicators like sign-ups or pre-orders, then refine as real data arrives.
Conclusion: Turn Your Excel Forecast Data into Action
Mastering your Sales Forecast Template Excel is a journey from uncertainty to clarity. It transforms your sales data into a credible narrative about your business future.
To get started:
- Download the Template.
- Enter your data and assumptions.
- Run your scenarios.
- Share with your team and update regularly.
- Refine continuously by comparing forecasts to actuals.
A forecast is never perfect—but when built well, it becomes a powerful decision-making tool. The goal isn’t perfection; it’s reducing uncertainty enough to act confidently.