Download a Break-Even Analysis Model designed by Wael Abed, Financial Modeling Expert.
H1: Break-Even Analysis: A Complete Guide with Examples in Excel
Meta Description: Learn Break-Even Analysis with Excel. Step-by-step guide, formulas, and examples to calculate break-even point and improve profitability.
Introduction
In today’s competitive business environment, understanding your Cost-Volume-Profit Analysis is essential for survival and growth. Entrepreneurs, startups, and financial managers often ask: “How many units must I sell to cover my costs?”
The answer lies in Financial Break-Evenis. This financial tool identifies the sales volume at which total revenues equal total costs, meaning your business neither makes a profit nor incurs a loss. Beyond theory, mastering this calculation in Excel can save time, improve decision-making, and enhance profitability.
In this guide, we will explain what Profitability Analysis is, why it matters, how to calculate it using Excel formulas, and practical examples with tables.
H2: What is Break-Even Analysis?
Break-Even Analysis is a financial calculation that determines the number of units or sales value required for a business to cover its fixed and variable costs. At this point, the business does not make a profit but also avoids losses.
- Fixed Costs: Expenses that remain constant regardless of production (rent, salaries, insurance).
- Variable Costs: Expenses that change with production volume (raw materials, direct labor, utilities).
- Contribution Margin: The difference between sales revenue and variable costs per unit.
Formula for Break-Even Point (in Units):
Break-Even Point (Units) = Fixed Costs ÷ (Selling Price per Unit – Variable Cost per Unit)
Formula for Break-Even Point (in Sales $):
Break-Even Point (Sales) = Break-Even Units × Selling Price per Unit
H2: Why Break-Even Analysis is Important
Break-even analysis is not just a mathematical formula. It is a strategic decision-making tool that helps businesses:
- Evaluate whether a product or service is financially viable.
- Set realistic sales targets.
- Decide pricing strategies.
- Control and reduce costs.
- Plan for profit growth.
Without knowing your break-even point, businesses risk underestimating costs and overestimating revenues.
H2: Break-Even Analysis in Excel
Excel is the most widely used tool for financial modeling, and it is perfect for calculating the break-even point. With formulas and built-in functions, you can:
- Input fixed and variable costs.
- Test different selling prices.
- Generate automatic charts showing the break-even point.
Example Excel Formula:
= Fixed Costs / (Selling Price - Variable Cost)
This formula instantly gives you the number of units required to break even.
H2: Example of Break-Even Analysis (Table)
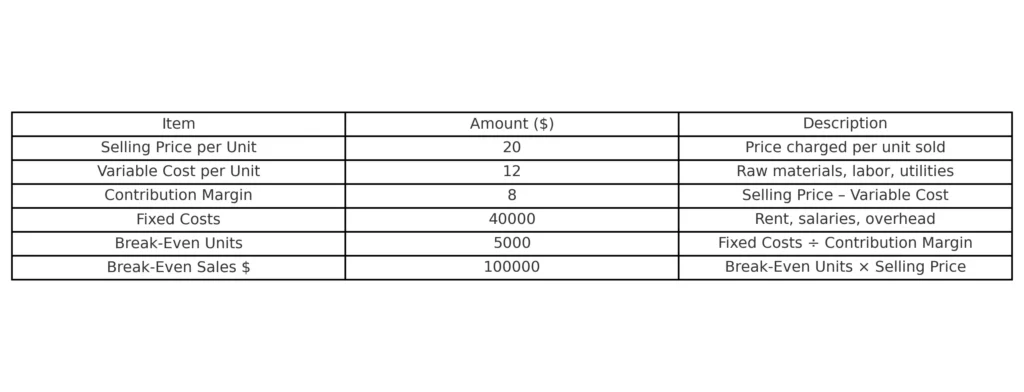
Here’s a simple example of break-even analysis for a company producing widgets:
| Item | Amount ($) | Description |
|---|---|---|
| Selling Price per Unit | 20 | Price charged per unit sold |
| Variable Cost per Unit | 12 | Raw materials, labor, utilities |
| Contribution Margin | 8 | Selling Price – Variable Cost |
| Fixed Costs | 40,000 | Rent, salaries, overhead |
| Break-Even Units | 5,000 | Fixed Costs ÷ Contribution Margin |
| Break-Even Sales $ | 100,000 | Break-Even Units × Selling Price |
This means the business must sell 5,000 units (worth $100,000) to cover all costs. Every unit sold beyond this generates profit.
H2: Applications of Financial Break-Even
H3: For Startups
New businesses can use break-even analysis to determine if their idea is financially sustainable.
H3: For Pricing Strategies
By adjusting selling price in Excel, managers can instantly see how profitability changes.
H3: For Cost Control
Comparing variable and fixed costs helps identify areas for reduction.
H3: For Expansion Decisions
Before investing in new projects, companies can calculate how much additional sales volume is required to break even.
H2: Advantages and Limitations of Break-Even Point
Advantages:
- Simple and easy to calculate.
- Helps in financial planning.
- Supports decision-making for pricing and cost control.
Limitations:
- Assumes constant selling price and costs.
- Ignores market demand fluctuations.
- Works best for single-product businesses.
H2: Visualizing Break-Even Analysis with a Chart
Excel allows you to create a Break-Even Chart showing total costs, total revenue, and the break-even point. This makes it easier for managers and stakeholders to understand the results.
X-axis: Number of Units
Y-axis: Costs and Revenues
Where the Revenue line intersects the Total Cost line, that’s your break-even point.
H2: Best Practices for Using Break-Even Analysis
- Always update data regularly in Excel.
- Test multiple pricing and cost scenarios.
- Use conditional formatting to highlight profit and loss areas.
- Combine break-even analysis with cash flow forecasting.
- Integrate findings into business strategy.
H2: Internal and External Resources
For practical applications, you can also explore related guides:
- Internal Link (Excel Clarity): For practical tools, explore our collection of Free Excel Invoice Templates to improve your financial workflow.
- External Link: For a comprehensive explanation of break-even concepts and formulas, you can read the detailed guide on Investopedia’s Break-Even Analysis
H2: Conclusion
Profitability Analysis is one of the most powerful tools for understanding your cost structure and profitability. Whether you are a small business owner, a startup founder, or a financial manager, knowing your break-even point helps you make better decisions, set realistic goals, and plan for sustainable growth.
By using Excel formulas, tables, and charts, you can easily calculate break-even points and adapt strategies based on real numbers.
Remember: The faster you reach your break-even point, the sooner your business starts making profit.
H2:Download Guide Text:
Body:
Take control of your business finances with our comprehensive and easy-to-use Break-Even Analysis Calculator. This powerful Excel template is pre-loaded with sample data and formulas to help you instantly calculate your profitability thresholds.
This calculator includes four specialized sheets:
- Contribution Margin: Calculates the exact number of units you need to sell to break even.
- Dollars: Determines the amount of revenue in dollars you need to cover all your costs.
- Goal Seek: A dynamic tool to see how your profit changes with different sales volumes.
- Graph: Automatically generates a visual chart to illustrate the relationship between your costs, revenue, and profits at different sales levels.
Simply input your own numbers in the designated fields for:
- Fixed Costs (rent, salaries, etc.)
- Variable Costs per Unit (materials, labor, etc.)
- Your desired Selling Price
The template will automatically calculate your total costs, contribution margin, and break-even point for you.