Download a Cash Flow Forecasting Model designed by Wael Abed, Financial Modeling Expert
Introduction: Why Excel is Your Most Powerful Cash Management Tool
Cash management in Excel is one of the most powerful ways to control your company’s liquidity and financial health. Managing cash flow effectively in Excel allows you to forecast, track, and optimize every transaction with precision. Cash management is the lifeblood of every business — the fundamental discipline of collecting, managing, and investing a company’s available cash. Poor cash flow management remains one of the main causes of business failure. Yet, many organizations still depend on intuition instead of data-driven strategies.
This is where cash management in Excel transforms from a technical skill into a vital business control system. Unlike expensive specialized software, Excel offers unmatched flexibility, transparency, and analytical depth. It empowers professionals to create tailored cash management systems that evolve with business needs.
In this comprehensive guide, you’ll learn how to build a complete cash management system in Excel — from dynamic forecasting models and real-time dashboards to advanced working capital optimization. Whether you’re a startup founder, a financial controller, or a small business owner, mastering these Excel techniques will give you total control over your company’s liquidity and financial health.
For more foundational financial templates, visit our Financial Analysis resources.
Chapter 1: Understanding Cash Management Fundamentals
1.1. What is Cash Management and Why It Matters
Cash management includes all strategies and systems used to handle a company’s cash inflows and outflows. Its primary goal is simple yet critical: to ensure liquidity, minimize risk, and maximize returns.
Core objectives of effective cash management include:
- Maintaining adequate liquidity for daily operations
- Optimizing accounts receivable and payable
- Forecasting future cash positions with accuracy
- Reducing borrowing costs and maximizing investment yield
- Detecting potential cash shortfalls early
1.2. The Three Essential Types of Cash Flow
Understanding these categories is essential before building any Excel model for cash management.
- Operating Cash Flow – Money generated from core business activities, such as revenue from sales minus operating expenses. It’s the best indicator of business health.
- Investing Cash Flow – Cash spent on or received from buying and selling assets, like property or equipment.
- Financing Cash Flow – Cash from or paid to investors and lenders, including loans, equity, and dividend payments.
Chapter 2: Building Your Cash Management System in Excel
2.1. Structuring Data for Maximum Efficiency
Before diving into analysis, structure your data correctly. A well-organized sheet ensures accuracy, scalability, and automation.
Best practices:
- Convert transaction data into an Excel Table (Ctrl + T)
- Use separate columns for date, description, category, amount, and type (inflow/outflow)
- Apply data validation for consistent categories
- Keep assumptions and input variables on a dedicated sheet
2.2. Essential Excel Formulas for Daily Cash Tracking
Here are the most useful formulas for automating daily cash tracking:
SUMIFS for category analysis:
=SUMIFS(Amount_Range, Category_Range, "Office Supplies", Date_Range, ">="&Start_Date)
XLOOKUP for quick balance retrieval:
=XLOOKUP("Bank Account A", Account_List, Current_Balance_List, "Account Not Found")
EOMONTH for period-end calculations:
=EOMONTH(Start_Date, 0)
IFS for automated categorization:
=IFS(ISNUMBER(SEARCH("invoice", Description)), "Accounts Payable",
ISNUMBER(SEARCH("payment", Description)), "Accounts Receivable", TRUE, "Other")
For more advanced techniques, explore our Essential Excel Formulas for Finance.
Chapter 3: Cash Flow Forecasting and Management in Excel
3.1. Building a Professional Forecasting Framework
A cash flow forecast predicts your future cash position based on expected inflows and outflows. To build one effectively:
Step 1: Set Up a Timeline
Generate a 12–24 month monthly timeline using the SEQUENCE function. Include beginning and ending cash balances for each period.
Step 2: Project Cash Inflows
Use historical sales data as a base, then apply growth rates and collection delays. In addition, account for seasonal variations.
Step 3: Estimate Cash Outflows
Classify expenses (fixed, variable, discretionary). Include payment terms, taxes, loan repayments, and capital expenditures.
3.2. Advanced Forecasting Techniques
Using FORECAST.ETS for Seasonal Trends:
=FORECAST.ETS(Target_Date, Historical_Values, Historical_Dates, 1, 1)
Scenario Analysis with Data Tables:
Test how changes in growth or payment terms affect your forecast.
Sensitivity Analysis:
Identify which assumptions have the greatest impact on cash flow and adjust accordingly.
Chapter 4: Working Capital Optimization Strategies
4.1. Managing Accounts Receivable Efficiently
Faster collections improve liquidity. Excel makes this measurable.
- Build an aging schedule using
COUNTIFSandSUMIFS - Calculate Days Sales Outstanding (DSO)
- Create dashboards to prioritize overdue invoices
DSO Formula:
=(Average_Accounts_Receivable / Total_Credit_Sales) * Number_of_Days
4.2. Optimizing Accounts Payable
Balance timing and relationships. For instance:
- Schedule payments to maintain liquidity
- Leverage early payment discounts wisely
- Negotiate better payment terms
Discount Evaluation Formula:
=IF((Discount_Amount / Total_Amount) > (Discount_Rate / (1-Discount_Rate)), "Take Discount", "Pay Later")
For more advanced formula techniques, see our guide on Essential Excel Formulas for Finance.
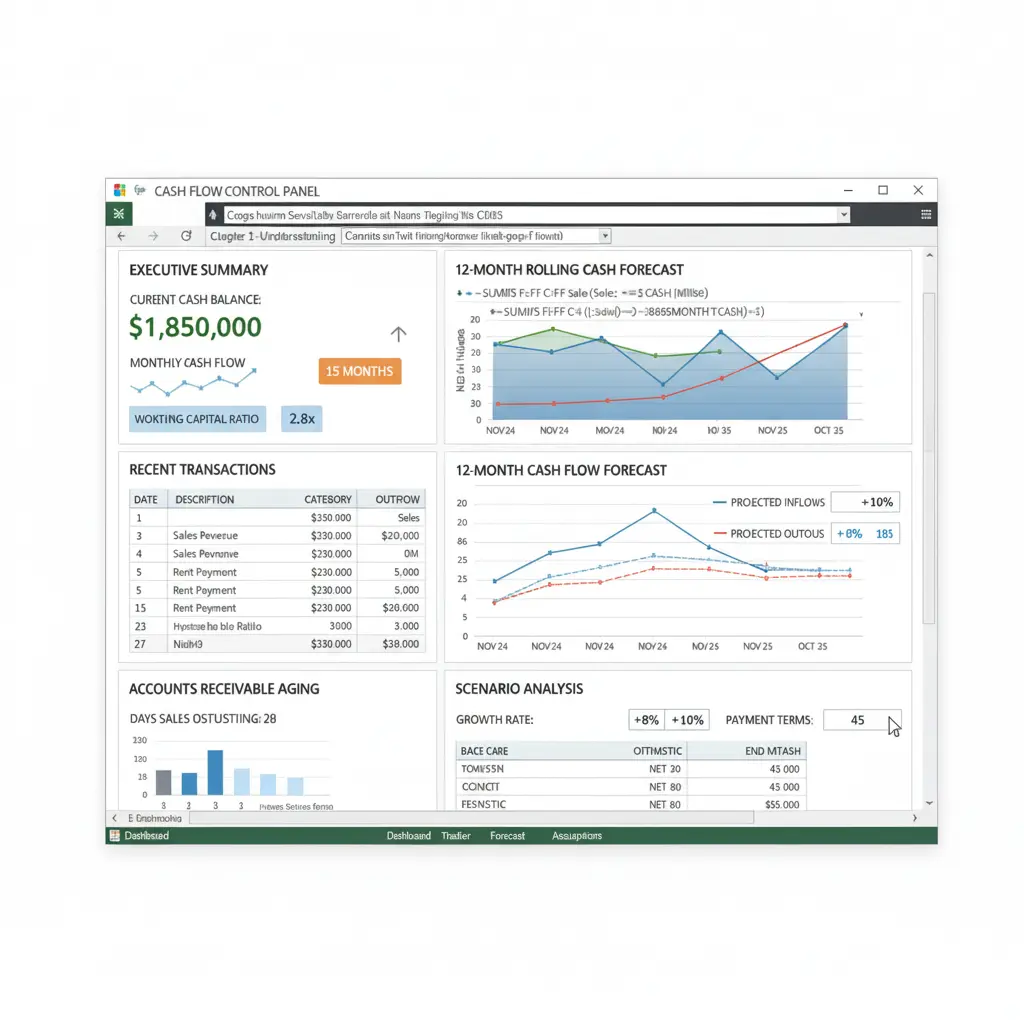
Chapter 5: Building a Cash Management Dashboard in Excel
5.1. Key Cash Management KPIs
A strong dashboard highlights:
- Cash Balance & Forecast
- Cash Burn Rate
- Cash Runway
- Working Capital Ratio
- Quick Ratio
5.2. Adding Interactive Features
Slicers: Allow filtering by category or time period.
Sparklines: Show quick trends.
=SPARKLINE(Range_of_Values, {"charttype","line"; "color","blue"})
Conditional Formatting: Trigger alerts when balances drop below a threshold.
Chapter 6: Advanced Cash Management Techniques
6.1. Variance Analysis
Variance analysis compares actual vs. forecasted results.
Variance = Actual - Forecast
%Variance = Variance / Forecast
6.2. Rolling Cash Forecasts
Unlike static models, rolling forecasts update automatically. Use OFFSET and MATCH to include the latest actuals.
6.3. Automating with Power Query
Power Query simplifies imports from multiple bank accounts. It transforms and categorizes transactions automatically — saving time and reducing manual errors.
Chapter 7: Common Cash Management Mistakes
- Overly optimistic projections → Use realistic assumptions
- Ignoring seasonality → Analyze historical patterns
- Poor timing of inflows/outflows → Reflect true payment terms
- Manual data entry errors → Use data validation and automation
To understand the financial theory behind these calculations, refer to Investopedia’s Working Capital Management Guide.
Chapter 8: Free Excel Cash Management Template
Download the Cash Management Template:
Includes a daily tracker, 13-month forecast, KPI dashboard, and automated alerts.
Features:
Fully automated calculations
Dynamic charts
Scenario testing
Clean, professional design
FAQ
What’s the best way to track cash flow in Excel?
Combine transaction-level tracking with a forecast model. Use Tables, PivotTables, and clear separation between actual and forecasted data.
How often should I update my forecast?
Weekly updates are ideal, though frequency depends on your liquidity situation.
What’s the difference between profit and cash flow?
Profit includes non-cash items; cash flow reflects actual money movement.
Can Excel handle complex cash management?
Yes — with Power Query and Data Models, Excel scales easily for growing businesses.
Remember, the most sophisticated system is useless if not maintained consistently. Download our free Cash Flow Statement Excel template now! Therefore, start today with one small improvement..
Conclusion: Transform Cash Management into a Strategic Advantage
Mastering cash management in Excel is more than spreadsheet work — it’s about building financial clarity and control. With structured models, dynamic dashboards, and proactive forecasting, you can turn uncertainty into strategic insight and drive smarter business decisions.