Download a Free NPV and IRR Calculator designed by Wael Abed, Financial Modeling Expert.
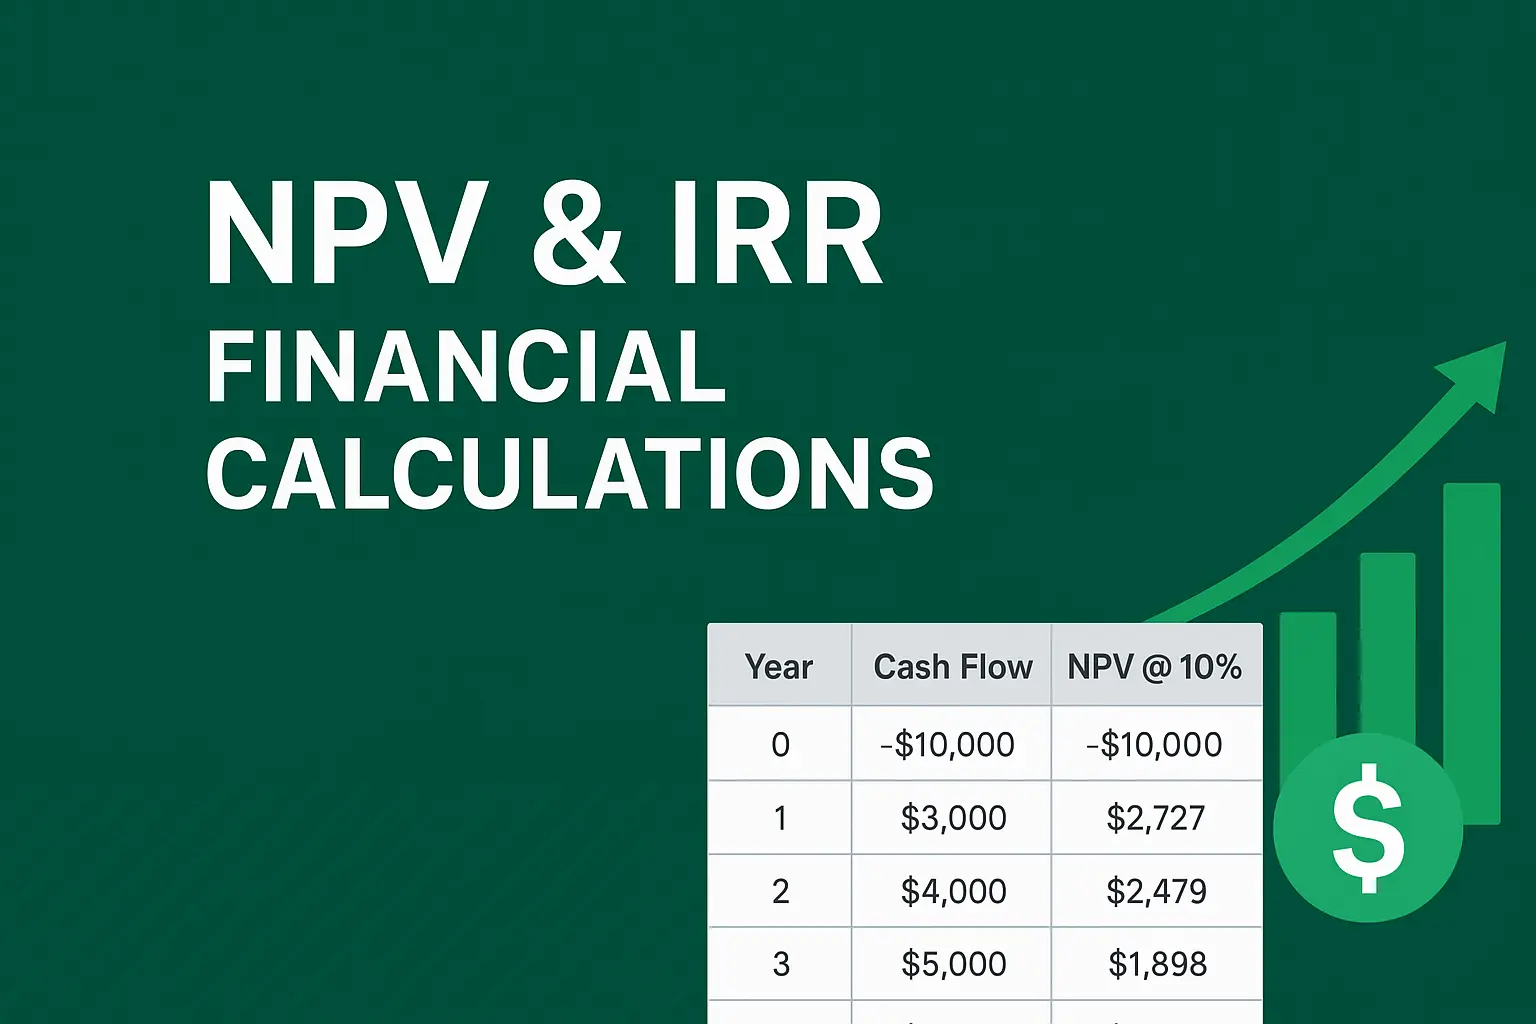
H1: How to Calculate NPV and IRR in Excel: The Definitive 2024 Guide
Meta Description: Master NPV and IRR calculations in Excel with our step-by-step guide. Includes free downloadable template, practical examples, and professional tips to make confident investment decisions. Learn the formulas and interpretation today.
SEO Title: NPV and IRR in Excel: Formulas, Examples, and Free Template | 2024 Guide
Focus Keyphrase: NPV and IRR in Excel
Alt Text for Featured Image: A professional Excel dashboard showing NPV and IRR calculations alongside a cash flow table and a graph.
Introduction: Why NPV and IRR Are Your Most Vital Financial Tools
In the world of finance and business investment, gut feelings are not a strategy. Every significant capital allocation decision—from launching a new product line to acquiring a competitor—rests on a bedrock of rigorous financial analysis. At the heart of this analysis lie two powerful metrics: Net Present Value (NPV) and Internal Rate of Return (IRR).
These concepts, while fundamental, are often misunderstood or incorrectly applied. This comprehensive guide will not only show you the mechanical process of calculating NPV and IRR in Excel but will also equip you with the knowledge to interpret the results and avoid common pitfalls. By the end of this article, you will be able to confidently evaluate the profitability of any project using a free, professional-grade Excel template.
H2: Understanding the Core Concepts: NPV and IRR Explained
Before we dive into Excel formulas, it’s crucial to grasp the « why » behind the calculations. Both metrics are rooted in a principle called the Time Value of Money (TVM).
H3: What is Net Present Value (NPV)?
NPV is the difference between the present value of cash inflows and the present value of cash outflows over a period of time. Think of it as a tool that converts all future project cash flows into « today’s dollars » and nets them against the initial investment.
- Positive NPV: The project is expected to generate more value than it costs (it creates wealth). You should proceed.
- Negative NPV: The project is expected to destroy value. You should reject it.
- NPV of Zero: The project breaks even in terms of the required rate of return.
The NPV Formula:NPV = Σ [Cash Flow_t / (1 + r)^t] - Initial Investment
H3: What is Internal Rate of Return (IRR)?
The IRR is the annual rate of growth an investment is expected to generate. More technically, it is the discount rate that makes the NPV of all cash flows from a particular project equal to zero.
- IRR > Hurdle Rate: The project’s return exceeds the minimum acceptable rate (e.g., your cost of capital). The project is attractive.
- IRR < Hurdle Rate: The project’s return is insufficient. The project should be rejected.
H2: NPV vs. IRR: A Head-to-Head Comparison
While NPV and IRR are related, they provide different perspectives. The following table outlines their key differences, which is critical for making sound decisions.
Table 1: NPV vs. IRR – The Ultimate Comparison
| Feature | Net Present Value (NPV) | Internal Rate of Return (IRR) |
|---|---|---|
| Measurement | Absolute value (e.g., $50,000) | Percentage return (e.g., 15%) |
| Benchmark | Compared to $0 | Compared to the Hurdle Rate |
| Scale | Reflects the project’s absolute value creation | Scale-independent; good for comparing project efficiency |
| Reinvestment Assumption | Cash flows are reinvested at the discount rate. | Cash flows are reinvested at the IRR itself. |
| Multiple Solutions | Always provides a single, clear result. | Can produce multiple IRRs with unconventional cash flows. |
| Best For | Deciding if a single project creates value. | Ranking and comparing projects of different sizes. |
Key Takeaway: Use NPV for the final « go/no-go » decision on a project. Use IRR to compare the efficiency of multiple projects against each other and your hurdle rate.
H2: A Step-by-Step Guide to Calculating NPV in Excel
Let’s apply the theory using a practical example.
Scenario: Your company is considering a $100,000 investment in new software. It is expected to save $35,000 annually for the next 4 years. Your company’s required rate of return (discount rate) is 10%.
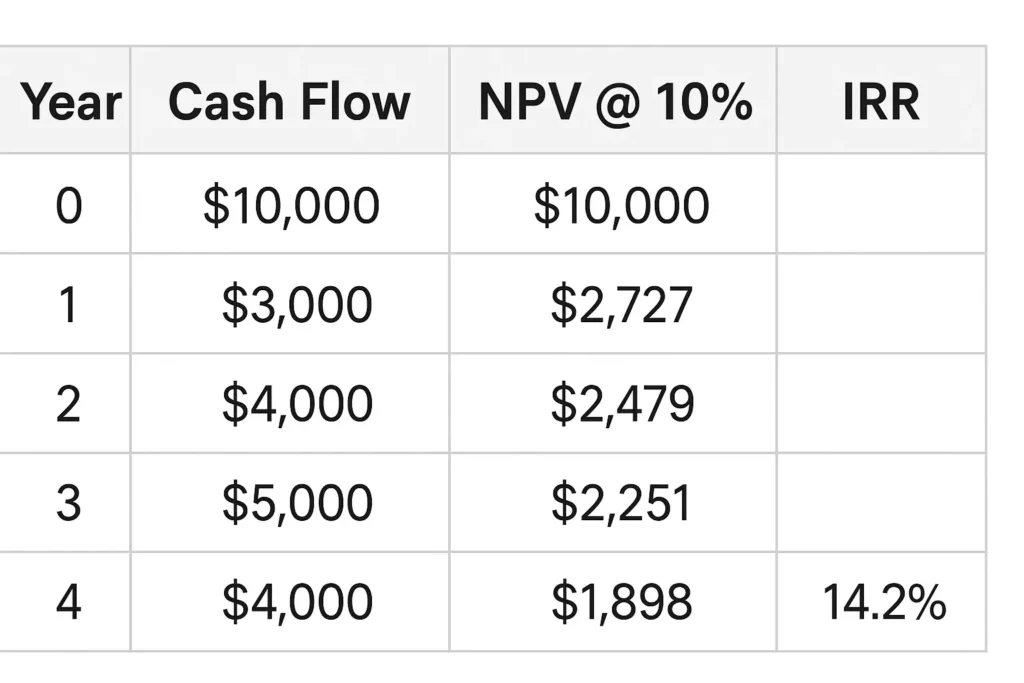
H3: Step 1: Set Up Your Cash Flow Table
Organize your data logically in Excel.
| A | B | |
|---|---|---|
| 1 | Year | Cash Flow |
| 2 | 0 | -$100,000 |
| 3 | 1 | $35,000 |
| 4 | 2 | $35,000 |
| 5 | 3 | $35,000 |
| 6 | 4 | $35,000 |
H3: Step 2: Use the NPV Function
The Excel NPV function syntax is: =NPV(rate, value1, [value2], ...)
Crucial Note: The NPV function in Excel assumes the first cash flow occurs at the end of the first period. You must exclude the initial investment from the range and add it separately.
In cell B8, you would write the formula:=NPV(10%, B3:B6) + B2
Result: The NPV is $10,946. Since it’s positive, the project is financially acceptable.
H2: A Step-by-Step Guide to Calculating IRR in Excel
Using the same cash flow setup, calculating the IRR is straightforward.
H3: Step 1: Organize All Cash Flows (Including Initial Investment)
Ensure all cash flows, including the initial outflow, are in a single, contiguous range (B2:B6 in our example).
H3: Step 2: Use the IRR Function
The Excel IRR function syntax is: =IRR(values, [guess])
- values: The range of all cash flows.
- guess (optional): Your guess for what the IRR might be. This is rarely needed.
In cell B9, you would write the formula:=IRR(B2:B6)
Result: The IRR is 15%. Since 15% is greater than our 10% hurdle rate, the project is acceptable.
H2: Advanced Scenario: Complete Project Analysis
Let’s examine a more complex, real-world scenario with uneven cash flows.
Table 2: Advanced Project Analysis – « Project Phoenix »
| Year | Description | Cash Flow | Present Value @ 12% |
|---|---|---|---|
| 0 | Initial Investment (Equipment) | -$250,000 | -$250,000 |
| 1 | Revenue – Operating Costs | $80,000 | $71,429 |
| 2 | Revenue Growth +15% | $92,000 | $73,316 |
| 3 | Major Maintenance Cost | $45,000 | $32,030 |
| 4 | Peak Revenue | $150,000 | $95,327 |
| 5 | Revenue + Residual Value | $200,000 | $113,485 |
| TOTALS | $317,000 | $135,587 |
Calculations and Interpretation:
- NPV:
=NPV(12%, B3:B7) + B2 = $135,587- The strongly positive NPV indicates significant value creation.
- IRR:
=IRR(B2:B7) = 22.4%- The 22.4% return is excellent, well above a typical cost of capital.
Decision: « Project Phoenix » is a highly profitable venture and should be approved.
H2: Limitations and How to Overcome Them
No metric is perfect. A professional analyst understands the weaknesses.
- NPV Limitation: Highly sensitive to the discount rate. A small change can flip the result.
- Solution: Perform a sensitivity analysis (see table below).
- IRR Limitation: The unrealistic reinvestment assumption and potential for multiple IRRs.
- Solution: Use Modified IRR (MIRR) in Excel (
=MIRR(...)), which allows you to specify a more realistic reinvestment rate.
- Solution: Use Modified IRR (MIRR) in Excel (
Table 3: Sensitivity Analysis – How NPV Changes with Assumptions
| Discount Rate | NPV | Project Viability |
|---|---|---|
| 8% | $178,950 | Strongly Accept |
| 12% | $135,587 | Accept |
| 16% | $98,125 | Accept |
| 20% | $65,650 | Accept |
| 22.4% (IRR) | $0 | Break-even |
| 25% | -$18,400 | Reject |
This table shows the project’s robustness. It remains profitable even if the actual discount rate is higher than initially planned.
H2: Practical Applications and Related Excel Skills
Mastering NPV and IRR calculations opens doors to more advanced financial modeling in Excel. These skills are particularly valuable when combined with other essential business functions. For example, understanding cash flow timing and projections is crucial when building comprehensive inventory management dashboards in Excel. Many of the same logical frameworks used in NPV analysis—such as forecasting future demand and optimizing cash conversion cycles—apply directly to managing working capital efficiently.
Internal Link: Learn how to build comprehensive inventory management dashboards with our complete guide to inventory management in Excel, which shares similar forecasting principles with NPV analysis.
External Link: For official function documentation, Microsoft’s NPV function support page provides the technical specifications and updates for Excel’s financial functions.
H2: Frequently Asked Questions (FAQ)
H3: Q1: My IRR formula returns a #NUM! error. What happened?
A: This usually means Excel couldn’t find a solution. Check that your cash flows include at least one negative and one positive value. If they do, try adding a « guess » argument to your IRR function (e.g., =IRR(values, 15%) based on your estimate.
H3: Q2: Which is better, NPV or IRR?
A: For a final decision on a single project, NPV is generally considered superior because it directly shows the value added in monetary terms and doesn’t have the same reinvestment rate flaw as IRR. However, they are best used together.
H3: Q3: What discount rate should I use for NPV?
A: The most common and correct rate is your company’s Weighted Average Cost of Capital (WACC). For personal investments, use your minimum acceptable rate of return.
H2: Conclusion: From Theory to Confident Practice
Mastering NPV and IRR transforms you from a passive number-cruncher into an active, strategic advisor. You now have the knowledge to:
- Calculate both metrics accurately in Excel.
- Understand what they mean and how they differ.
- Interpret the results to make sound « go/no-go » decisions.
- Recognize their limitations and use advanced techniques to overcome them.
To put this knowledge into practice immediately, download our free, pre-built Excel template.
Download Your Free NPV & IRR Excel Template Here