Download a 3-Statement & DCF Model designed by Wael Abed, Financial Modeling Expert.
Financial Modeling in Excel is one of the most valuable skills in modern finance. It transforms a simple spreadsheet into a strategic decision-making tool, capable of forecasting profitability, evaluating investments, and assessing business value. From startups to multinational corporations, every financial analyst and business leader relies on Excel to model the future and make data-driven decisions.
This guide is your complete roadmap to mastering professional financial modeling in Excel. It explains how to build a fully integrated 3-Statement Model, apply the Discounted Cash Flow (DCF) valuation method, and follow best practices that ensure accuracy, clarity, and scalability. With structured steps, formulas, and design rules, you will learn how to transform data into insight and insight into action.
H2: Mastering Excel Financial Modeling & Analysis
Financial modeling is not just about entering numbers in a spreadsheet. It’s about understanding how financial statements interact, predicting the future of a business, and valuing opportunities based on cash flow potential. A professional model links the Income Statement, Balance Sheet, and Cash Flow Statement dynamically. This connection turns Excel into a living financial engine that updates automatically as assumptions change.
A robust financial model spreadsheet allows you to:
- Forecast revenues, expenses, and profitability.
- Evaluate intrinsic value using Discounted Cash Flow (DCF).
- Support fundraising and investment negotiations.
- Quantify risks and perform scenario analysis.
- Align strategy with financial performance in real time.
Mastering financial modeling in Excel gives you the ability to translate strategy into measurable results, making it one of the most in-demand skills in finance and business management.
The Core Structure of a Financial Model
A professional model follows a clean, logical structure that makes it easy to read and audit. Every spreadsheet should include three fundamental sections:
- Inputs (Assumptions) – Growth rates, costs, and key drivers.
- Calculations (Working Schedules) – Detailed computations for revenues, costs, depreciation, debt, and more.
- Outputs (Financial Statements) – The final results presented in the Income Statement, Balance Sheet, and Cash Flow Statement.
This consistent structure improves transparency, reduces risk, and ensures that other professionals can easily review and trust your model.
H2: Pro Excel Modeling: 12 Financial Rules
1. Maintain a Clear Structure
Follow the sequence: Inputs → Calculations → Outputs. Never mix assumptions and results on the same sheet.
2. Use Color Coding
- Blue: Hard-coded inputs.
- Black: Calculations.
- Green: External links or references.
This color code helps any user immediately identify what can or cannot be edited.
3. Avoid Hardcoding in Formulas
Every assumption (growth rate, tax rate, etc.) should live in its dedicated input cell. This improves flexibility and prevents hidden errors.
4. Ensure Logical Flow
Always build schedules in chronological order. Revenue drives operating expenses, which drive net income, which then flows into the balance sheet and cash flow statement.
5. Keep Dates Dynamic
Use one start date cell linked to all time periods with formulas like =EDATE(StartDate,12) for yearly models. Changing one cell updates the entire timeline instantly.
6. Build with Auditability in Mind
Insert visible error checks (e.g., “Balance Sheet does not balance”) that turn red when inconsistencies appear.
7. Minimize Volatile Functions
Avoid formulas like OFFSET and INDIRECT, which slow recalculations. Prefer stable functions such as INDEX, MATCH, XLOOKUP, and SUMIFS.
8. Use Data Validation
Restrict user inputs with lists or numeric rules. This prevents unrealistic entries such as text in a numeric cell.
9. Keep the Model Scalable
Design tables so that new years or quarters can be added by dragging formulas to the right. A scalable spreadsheet is a professional one.
10. Document Everything
Add a dedicated “Notes” tab explaining complex formulas and assumptions. Transparent documentation builds credibility.
11. Manage Circular References Carefully
Some loops (like interest affecting debt and cash) are intentional. Enable iterative calculations, but clearly document them.
12. Design for the User
Clean formatting, aligned borders, and consistent spacing create confidence and reduce user fatigue. A well-designed model reflects professionalism.
For more on financial analysis techniques, see our guide on conducting a break-even analysis in Excel. When working with lookups specifically, refer to Microsoft’s XLOOKUP function guide for official documentation
H2: Building Integrated Financial Models in Excel
The integrated 3-Statement Model is the backbone of financial modeling in Excel. It connects the company’s profitability (Income Statement), position (Balance Sheet), and liquidity (Cash Flow Statement) in one dynamic system.
H3: Excel Financial Statement Modeling – Income
The Income Statement measures profitability over time. Begin by projecting revenue drivers such as units sold, customer growth, or pricing.
Example Formula:=PreviousYearRevenue * (1 + GrowthRate)
COGS and Gross Profit
Calculate COGS as a percentage of revenue.=Revenue * COGS%
Then compute Gross Profit:=Revenue - COGS
Operating Expenses (OpEx)
Split expenses into:
- Variable Expenses: Change with sales (e.g., commissions).
- Fixed Expenses: Remain stable, adjusted for inflation.
Depreciation & Amortization
Link D&A to your PP&E schedule to reflect the cost of assets over time.
Net Income
EBT = EBIT - Interest ExpenseTax = EBT * TaxRateNet Income = EBT - Tax
This net income flows into retained earnings and the cash flow statement.
H3: Excel Financial Statement Modeling – Balance Sheet
The Balance Sheet provides a snapshot of assets, liabilities, and equity. It must always balance.
Working Capital Schedules
| Item | Formula Driver | Linkage |
|---|---|---|
| Accounts Receivable | Days Sales Outstanding (DSO) | Driven by Revenue |
| Inventory | Days Inventory Outstanding (DIO) | Driven by COGS |
| Accounts Payable | Days Payable Outstanding (DPO) | Driven by COGS |
Example Formula:= (Revenue / 365) * DSO
Property, Plant & Equipment (PP&E)
Ending PP&E = Beginning PP&E + CAPEX - Depreciation
Link CAPEX to investment assumptions and depreciation back to the income statement.
Debt & Equity
Ending Debt = Beginning Debt + New Borrowing - RepaymentsEnding Retained Earnings = Beginning R.E. + Net Income - Dividends
Finally, calculate the Cash Plug to make sure:Assets = Liabilities + Equity.
H3: Excel Financial Modeling for Cash Flow
The Cash Flow Statement reconciles the beginning and ending cash balances. It starts with Net Income, adds non-cash items like Depreciation, adjusts for Working Capital, and accounts for Investing (CAPEX) and Financing (Debt).
Check:Net Change in Cash = Ending Cash - Beginning Cash
If it doesn’t match, there’s an error in your linkages.
H2: Advanced Financial Analysis: DCF in Excel
Once your 3-Statement Model is balanced, you can use it to perform a Discounted Cash Flow (DCF) valuation — the gold standard for determining business value.
Free Cash Flow (FCF) Formula
FCF = EBIT × (1 − Tax Rate) + Depreciation − CAPEX − ΔWorking Capital
This represents the cash available to all investors after operating and capital expenses.
Weighted Average Cost of Capital (WACC)
WACC = (E/V × Re) + (D/V × Rd × (1 − T))
Where:
- E/V and D/V are equity and debt proportions.
- Re = Cost of Equity (from CAPM).
- Rd = Cost of Debt.
- T = Tax rate.
Terminal Value (TV)
TV = Final Year FCF × (1 + g) / (WACC − g)
where g is the perpetual growth rate (typically 2–4%).
Enterprise and Equity Value
Discount all future FCFs and the Terminal Value back to the present using WACC.Enterprise Value = Σ (FCF / (1 + WACC)^t)Equity Value = Enterprise Value − Net Debt
Implied Share Price
= Equity Value / Shares Outstanding
Example Spreadsheet Summary Table
<table>
<tr><th>Statement</th><th>Key Formula</th><th>Purpose</th></tr>
<tr><td>Income Statement</td><td>=Revenue - COGS - OpEx</td><td>Measures profitability</td></tr>
<tr><td>Balance Sheet</td><td>Assets = Liabilities + Equity</td><td>Tracks financial position</td></tr>
<tr><td>Cash Flow Statement</td><td>Net Income + Non-Cash + ΔWorking Capital</td><td>Shows liquidity flow</td></tr>
<tr><td>DCF Valuation</td><td>Sum(FCF / (1+WACC)^t)</td><td>Determines business value</td></tr>
</table>
Professional Formatting and Design Tips
A model that looks professional builds instant trust. Use clear headings, gridlines, and consistent font sizes. Freeze top rows for navigation, and create a dashboard tab with key metrics, charts, and KPIs. This transforms your spreadsheet into a presentation-ready tool.
Internal and External Resources
- Internal Link: Learn more about Financial Analysis.
- External Link: Explore detailed valuation principles on Investopedia.
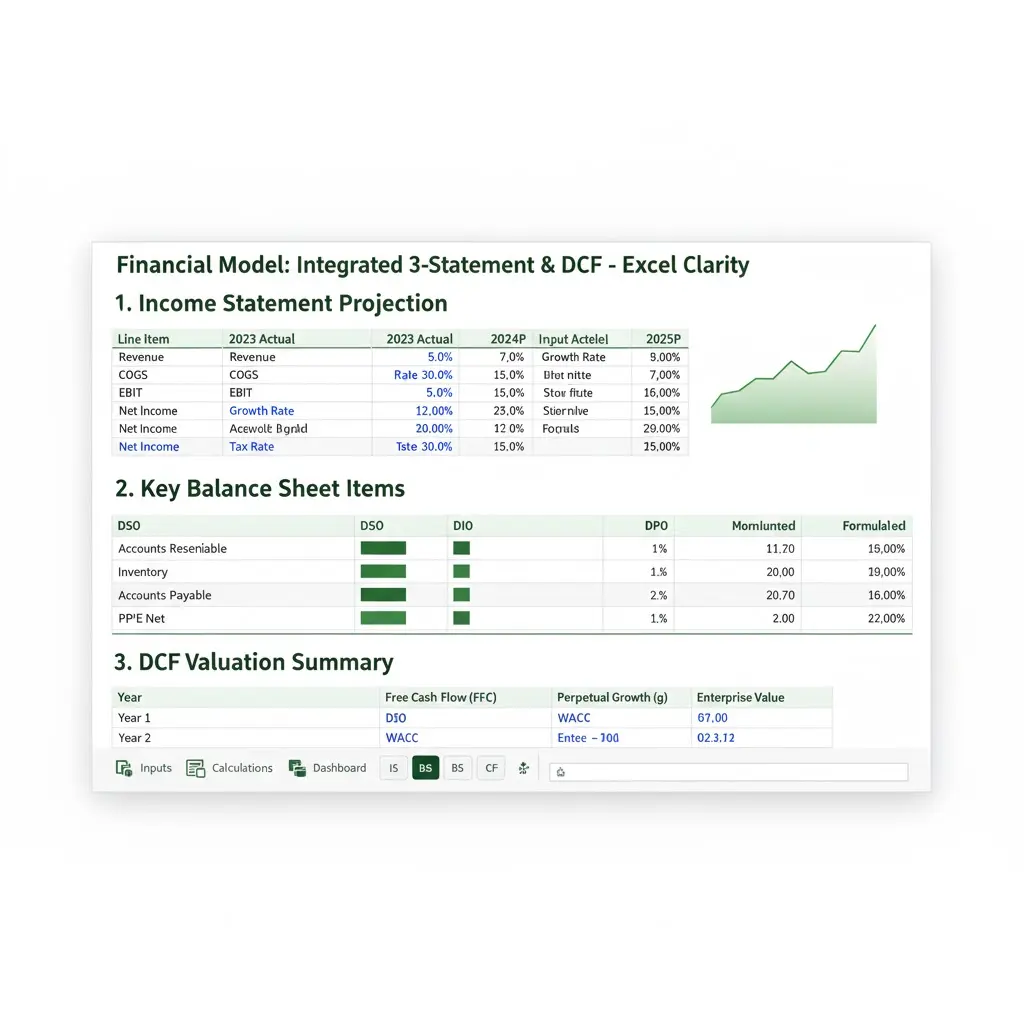
H2: Free Excel Financial Model Template
Take your learning further with our professional 3-Statement + DCF spreadsheet template. It’s fully automated and designed according to the 12 Golden Rules. Use it to follow this guide and create accurate financial forecasts for your projects.
Download Your FREE Excel Financial Model Template
Conclusion
Mastering Financial Modeling in Excel empowers you to think like a strategist and act like an investor. A well-built spreadsheet is not just a file—it’s a dynamic system that reveals the financial heartbeat of a business. By integrating the three financial statements, applying the DCF method, and following best modeling practices, you’ll gain the confidence to analyze, forecast, and make impactful business decisions.
Whether you’re an analyst, entrepreneur, or executive, this guide is your gateway to financial clarity and professional excellence.